Ugh! Metrics
Government Affairs professionals often dread the question of how we measure success. One reason is that many of us believe that what we do is complex and ambiguous and does not lend itself to metrics in the same way that sales and other functions do. Another reason may be that no-one enjoys being measured since it establishes a yardstick against which you can fail.
The challenge, however, is this: if you do not measure anything you have no idea of how you are keeping score. That in turn means that you have given up the ability to win to avoid the risk of losing – and that trade off does not work out well in the long term, especially not if there is an economic downturn and the CFO starts looking at necessary and unnecessary costs.
The best way to approach this – admittedly hard – problem is to look at a basket of metrics that can be applied to government affairs and see how that basis applies to your particular business. There is actually a surprisingly rich variation across different metrics that allows us to reflect the complex nature of our craft, and we should be careful to recognize that no single metric will do – we need to represent several different aspects of the function.
It is important to point out that exactness is not what we are looking for here – the impossibility of exactly calculating the value of government affairs work is not an argument against a fuzzy assessment. What we want is an order of magnitude, coarse grained model for metrics that allows us to keep score. Even just working through a model that we know is wrong can be deeply useful.
Here, then, is a non-exhaustive list of types of metrics that you can experiment with.
Activity metrics
This is by far the most common type of metric employed in general business functions – it simply looks at what we have done and counts the number of meetings, seminars, letters sent or replied to, hearings we appear at, contacts that we have listed in our network mapping, opeds or articles in our favor, advocates that have spoken out for us — the list can be made much, much longer – but activity metrics remain weak if they are taken on their own. The reason is obvious – activity metrics do not say anything about how all the activity strengthened the company’s strategic position.
Activity metrics can be translated weakly to economic value by assessing cost / benefit for every activity — but that is hard if there is no clear understanding of the benefit of a meeting, which leads us to the next category.
Outcome or impact metrics
This category is much more interesting, and looks at what the policy team has been able to accomplish for the company. The examples include legislation shaped in ways that help the company, markets opened, new bills introduced that open or close off a market, deals closed, companies successfully acquired — the list can be made very long.
Ideally these outcomes are directly related to the business plans, but they can also be long term shifts in the policy landscape and the clearing of a path to a certain end state that is assumed in the business plans. One such example would be the deregulation of TV in Europe, where the end state was a fully competitive TV-market and the starting point was state monopolies. Business plans have to work shorter term – get advertising, sponsors, buy and acquire content – but the policy outcome can be long term – a deregulated TV-market landscape.
If you are working in a regulated market, a lot of the work will ultimately aim at organizing that market in such a way that you can thrive as an incumbent or challenger – and the outcome there may be years away, but can then be decomposed into shorter term goals.
Outcome metrics should be possible to translate into the corresponding business wins, as a necessary part of those wins at some percentage. I would prefer to stay low rather than high here to reflect that while the work the team does may well be, and often is, necessary – it is not sufficient. It is very rare that a single policy team at a single company can claim a win without any assistance from events, other actors etc.
But to not apportion part of the revenue unlocked by policy work to that work is obviously wrong, and fools people into thinking that the policy work is nice-to-have rather than need-to-have.
Capability metrics
An often underestimated way to measure success is to ask what capabilities you have built. Especially when building a policy team from the ground up, this is an important category of metrics.
Here, it is about what the company has the ability to do routinely and well. Examples include things like being able to reach the relevant decision makers in key markets with in a 24 hour turnaround time, being capable to get significant third party support in letters and opeds on issues that you care about, the capability to shape trade association positions, the capability to rally customers to policy causes — you want to map out the core things that are helpful to you and then grade yourself on these capabilities to ensure that they are in place.
This is largely a readiness metric, a measure of how much policy challenges a company can absorb with a reasonable chance at getting out on top of those challenges.
The economic value of readiness is tricky to assess, but you could use a coarse-grained model that asks how much it would cost to buy the capability from a consultant in hours. The ability to reach key decision makers, to take one example, is often something key consultancies can offer, but at very steep prices.
In a way the choice of developing capabilities in-house or outsourcing them is an economic calculation that reflects the value of these capabilities and allows you to assess their value.
Risk-based metrics
When analyzing the policy and government affairs issues facing company a commonly employed method is organizing risk in an impact / likelihood matrix. This leads to a model of risk in which you should be able to say about each risk roughly how likely it is according to some scale (unlikely, possible, likely is one example) and what the impact will be (low, medium, high).
Policy work is a component in reducing the risks, and so one possible metric is the number of risks that you have been able to either reduce the likelihood of or mitigate the impact should they happen.
There is often resistance to making the assessments more numerical, but we can do that and still retain the coarse-grained nature that reflects the ambiguity inherent in any mapping of this kind.
For likelihood we can use less than 10%, 10-50%, 50%-75%, +75% and for impact we can use order of magnitude cost – is this a 100 000 USD risk, a million, 10 million, 100 million or a billion risk?
The metrics follow from such a numerical model: if we reduce a million dollar risk from 75% to below 50% the value of that is simply the reduction times the cost of the risk – 250k modified by a factor that allows that all of the risk reduction was not due to the work of the policy team (why, you may ask, do I stress this? For realistic assessment; in the long run reflecting the value you add on the low end is a way to not get stuck with overinflated impact numbers).
The other problem this model raises is the question of subjectivity. Who decides that these are the risks and the impact at any point in time? This is a great question, and a policy team that rates its own homework rightly should be criticized for it. The trick here is to agree with the key stakeholders in the company — you mitigate subjectivity by adding other subjectivity.
One way of doing this is to do quarterly risk reviews with the internal clients, looking at the risk landscape and agreeing where risks have been mitigated and where they remain the same. This also is a way to connect activity to outcomes – reviewing and arguing that activities indeed lead to impacts that reduce risks or mitigate outcomes.
If the company agrees as a leadership that a certain risk has been reduced, sees a pattern of activities that plausibly could affect the outcome – then it would be both irrational and unprofessional to deny that the government affairs work mattered and impacted the shifts and changes. In that case the problem is trust between government affairs and the leadership of the company, not metrics.
Sentiment, press etc metrics
Another interesting method is to assess sentiment across different sources (social media, traditional press, customers, peer companies). Such sentiment analysis can be done across a number of different factors – favorability and advocacy are the two most often used. Favorability simply measures if the respondent views your company favorably – if they think you mostly add value, act fairly and if you are a net contributor to the markets and societies you are active in. Advocacy asks if people are willing to defend or speak up on your behalf, if they have recommended your services to others and if they generally speak well of you.
The measurement of sentiment is popular, because it builds on a model where government affairs is about your reputation. This is also the key weakness of this model. Reputation is determined by a multitude of factors – and the view of your individual company is just one. Others include the views people hold about your industry, about companies your size etc. Unpicking what is what is hard, and usually requires broad industry sentiment background to get a good picture. It is in the differential with comparable peers that you get at really interesting values.
For tech companies it is less interesting to understand their own sentiment analysis than the differential between that and that of their peers. Now, it may well be that a company wants to also push for a rehabilitation of their industry (large tech companies have a problem across their individual sentiment, the industry sentiment and the sentiment around technology generally that they have to deal with) – but that is much harder and dependent on all of the peers to behave in a certain way.
Sentiment analysis remains a key metric for many companies and is a valuable tool to understand what people think about your company and industry – but should not be used as a stand alone metric.
Economically sentiment analysis is often translated to brand value. The value of a brand shifts over time and aggregates a ton of different inputs, so provides a noisy signal at best – but it can be used in different ways. If you assume a factor of the brand value that belongs to the policy and reputation work, you can work backward from there and then suggest different assessments – what if 1% of the brand value is dependent on the policy work? How do I use this?
Again you need to look at the differential. If you have companies A, B, C and D and you want to assess the impact of policy, and your starting assumption is that 1% of brand value is policy – then you can look at the way that brands change. If, then, all brands drop in value – A with 40%, B with 20% and C and D with 10% – then the policy value could be – this is not an exact science – the differential with the greatest loss.
This model is fuzzy and imprecise, but suggests a rough assessment that can at least be put in to the wider bucket of metrics.
Business metrics
In some cases policy is directly related to sales. In government procurement policy efforts may be an integrated part of the sales process — ensuring that the right stakeholders are comfortable, that the product is seen as compliant with often unclear standards and requirements as well as ensuring that the bidding process is open and transparent are examples of activities that matter a lot to such sales. Here a part of the value of the deal should be apportioned to the policy work. It is useful to argue about how much – and to ensure that the business has a decisive say in that. If you do get agreement on that the long term value of the business recognizing the importance of work is priceless.
Other examples include market introductions where policy may be a part of opening doors, ensuring a good start and unlocking the potential value in a market. Here the maths are even more fuzzy, but the total addressable market opened is a good starting point, and even accepting that a very small part of the unlocking of that value accrues to policy is useful. Say your company enters a 100 BUSD market and that the introduction is welcomed by key political stakeholders, even though national incumbents have been critical – what is the value of that? You need not claim more than 0.01% to actually have generated 100 million USD of value. And here you may even admit to 0.001% and still have made a really important impact for the company. The one thing everyone should agree on is that the impact cannot be 0% – because then the policy team should not have been asked to engage at all.
The allure and challenge of business metrics is that in any business the profit and loss statement will be complex and often difficult to analyze into component parts – but not even trying is likely to make policy look like a nice-to-have function.
Internal client satisfaction metrics
An often overlooked way to measure the value of the work that government affairs does is to simply ask internal clients how satisfied they are with the policy support that they get, given the resources deployed and the challenges facing the company. This should not devolve into a discussion of how happy these clients are with the political climate over all (and that is a real risk) but should focus on if they believe that, given the restraints on the policy team, they are getting what they need.
Such internal client reviews are underrated, and good feedback internally is rare and hard to find. But it is crucial to ensure that such mechanisms exists in order to understand the perceived value brought by the government affairs work. Such surveys also offer an educational opportunity for the policy team – both to learn how they are perceived and valued and to understand what is valued most by internal clients.
Portfolio audits
This is a very simple method that starts from a) the state of our portfolio today and b) its composition. If we look at the state, we would judge it on the following components:
- Do we have an operational relationships portfolio? (i.e. is it embedded in our external engagement work across functions)
- Are we curating it – updating people, on and off boarding them, investing time rationally?
- If we benchmark it against others – is our portfolio better or worse than our core competitors?
The second question, on composition, is simply about if we have the right people in the portfolio and if we engage with them at the right level. As a metric we would answer these questions today, and then do quarterly check ins.

This would allow for a regular check in and also for targeted efforts to ensure that we reach the composition we want. Portfolio audits would also allow for regular updates and new inclusions in the portfolio (as well as off-boarding investments that have not worked out).
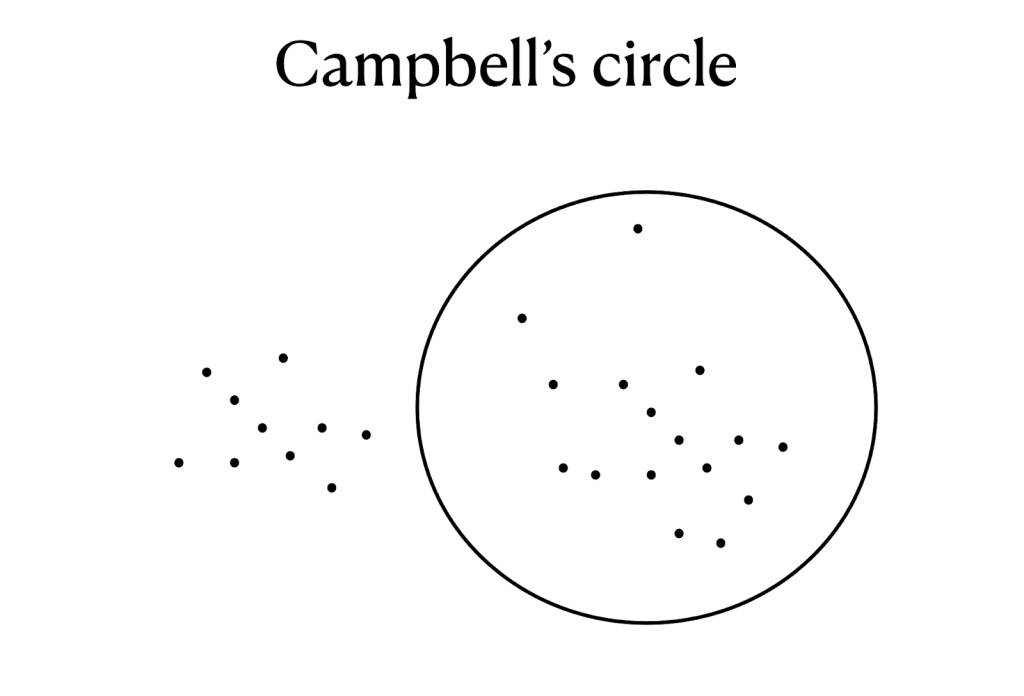
Campbell’s circle
The other possible model is one that Alistair Campbell used as Blair’s spin doctor. He once gave a lecture to Google’s policy team, laying down a few basic rules that he considered really important. One of the rules was that external engagement is tedious work. He drew a circle on the white board and then made little dots in it, saying that every dot was a message that landed. If you were off message you landed outside the circle. If you were on message you still just got a dot. Massive engagement is needed to get a message through – finding the message is the easy bit, landing it is the hard bit.
One metric, then, that we can use is this circle: every engagement we make is either a dot in the circle or outside the circle.
As we progress we should have a white board where we update every week (a political campaign does this daily) and put dots in our outside the circle.
This makes another point that I think is often lost: metrics should not be something we come to at the beginning and then end – it should be a continuous exercise. Keeping score is one thing, but deciding in what cycles you keep score – how long the game rounds are – is also important. We can do daily pace, but that would probably be too brutal – we should at least have a weekly metrics cycle however!
This also helps create a healthy and strategic impatience.
The value of delays
One thing that is rarely taken up in the discussion of metrics for government affairs is the value of delays. Let’s look at a very simple example: assume you are facing a competition investigation likely to end up with 1 BUSD in fines. This sum can increase over time of course, but let us assume for now that the sum is constant – what then is the value of dragging that process out for 10 years?
The obvious answer to that is that it is some percentage of the return on an alternative investment of that money over time. If you can invest that billion at 10% return, and assume that policy contributed to delay at 1% (relative not absolute) of that – then the value of the delay is 1 MUSD apportioned over ten years.
The same holds for compliance investments that can be delayed over time – but here the case is trickier, since compliance investments are not pure losses – like fines – but investments in an industry structure and a set of entry barriers that are likely to also have a protective effect on your industry.
The challenge of pace
One reason that many teams end up measuring activities is that they happen at a faster timescale than impacts. You want to show progress monthly and outcomes can take years to accomplish – so you measure the activities to show that there are indeed things happening. If you do so it is important to tie all activities to outcomes.
In reporting this may look simply like this.
X meetings to ensure that bill Y has qualities Z.
Connecting the activities to the outcome also allows you to see how efficient they were. If you managed to get Z into our out of the bill the set of activities carry a weak causality to the outcome.
Government affairs usually plays out over timescales that are very different than the quarter-to-quarter financial reporting most companies are locked into. That does not mean that we should not measure policy contributions in financial terms, but it means that we should think hard about how to build models that help translate long term impacts into understandable financial metrics in different ways.
Summing up
At least two things are true about metrics – the first is that without metrics you don’t know if you are succeeding, and the second is that you manage what you measure. Between these two insights you need to find middle ground. The best course of action is to construct a basket of metrics and take stock regularly to understand where things stand. But the perhaps most important insight when it comes to metrics is that they need to be shared metrics with the rest of the business – you should not measure your own success. This is hard, and many government affairs teams shy away from this, but this is a mistake. You are being measured by the rest of business anyway! Make sure that you articulate those metrics and agree on them rather than avoid seeking out challenges and negative assessments of your work.
Metrics ultimately flow from a shared model of reality, and that is the underlying key of success for any government affairs team.
